EV rate design keeps coming back to one question: when does charging energy arrive, relative to the hours that drive cost? For public charging, the answer has mostly been assumed. It has been simulated from driver models, or inferred from the tariff windows the charging was expected to respond to.
I’ve published a measured reference for it: the EV Charging Load Shape Benchmark (EV WATTS). It’s free under CC BY 4.0 and citable at doi.org/10.5281/zenodo.22884170. This post shows what the shapes say about a typical 4–9 pm window, and where they stop being useful to a rate case.
What it is
- 709 measured 24-hour charging shapes for US public charging, national and by Census division. Each shape is a venue by charger level, day type and season.
- Built from 13,937,235 sessions in the public-domain EV WATTS dataset, 2019–2022.
- A 95% interval on every hourly value, plus the range across two ways of spreading a session’s energy over its hours.
- Non-Tesla networks only. The source contains zero Tesla/NACS connectors.
The window share, by venue
Take a 4–9 pm window (16:00–20:59) and ask what share of a weekday’s delivered public-charging energy falls inside it. A perfectly flat day would put 20.8% there.
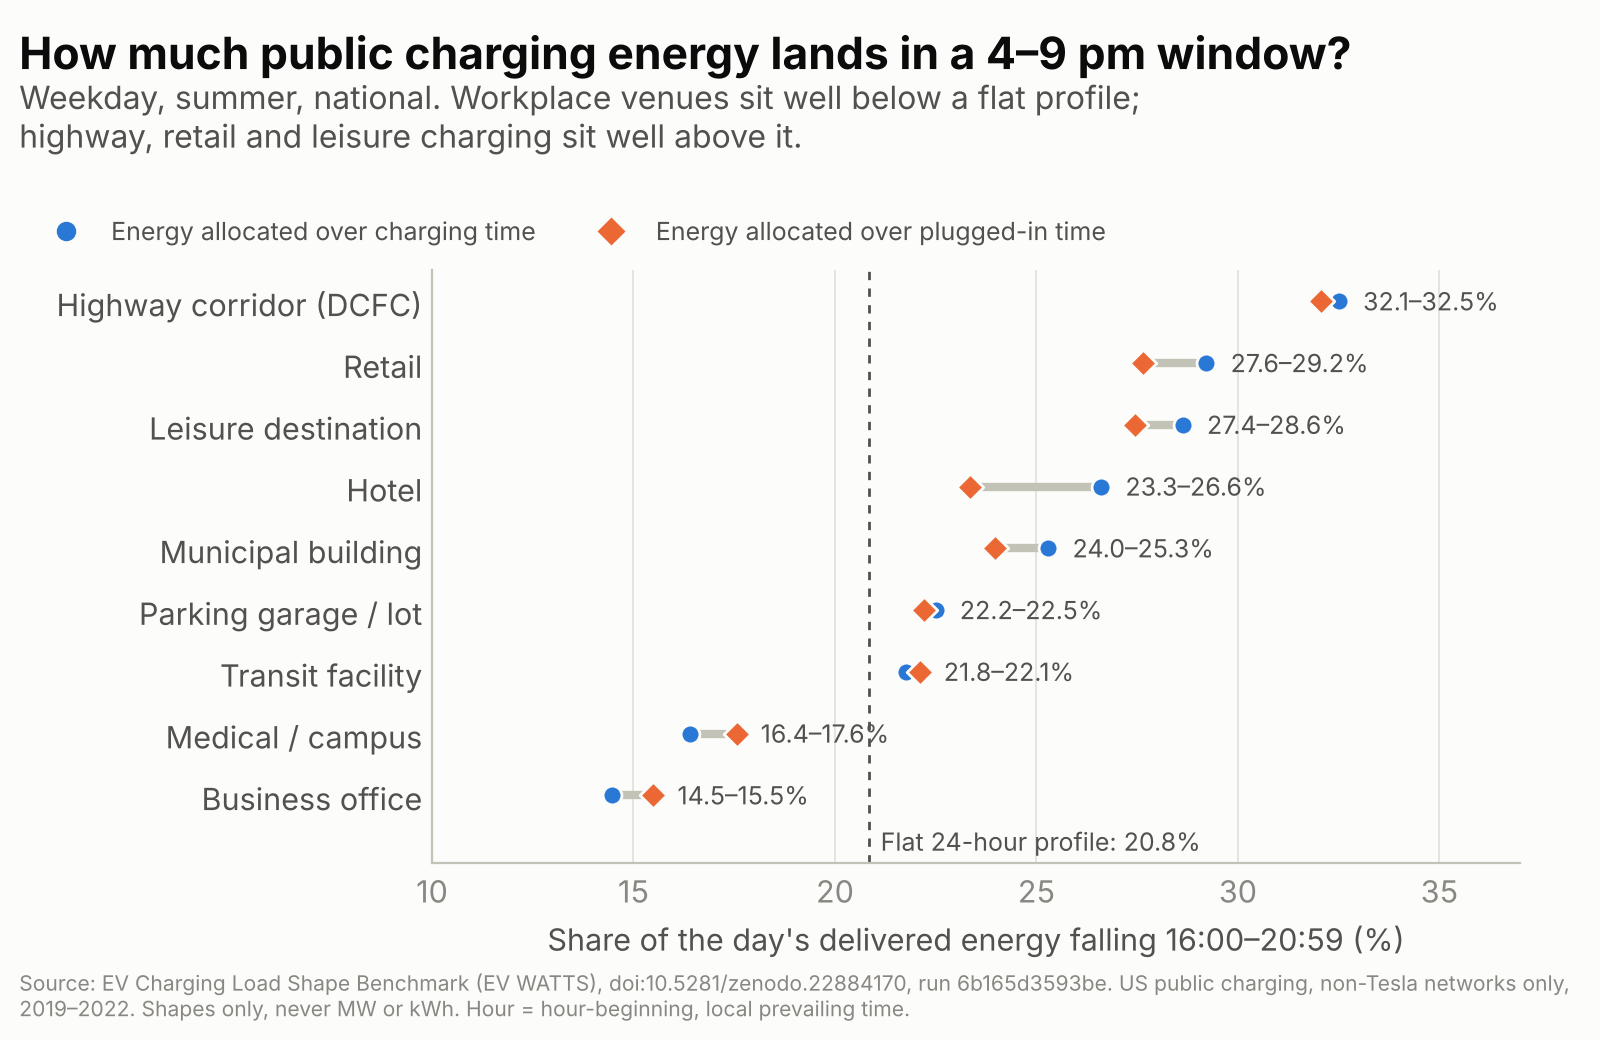
The spread is wide:
- Business office: 14.5–15.5%. Medical or educational campus: 16.4–17.6%. Workplace charging is a morning phenomenon and sits well below flat.
- Highway corridor fast charging: 32.1–32.5%, well above flat. The corridor afternoon peak runs straight into the window.
- Retail at 27.6–29.2% and leisure destinations at 27.4–28.6% are also well above flat.
Each range covers the two energy-allocation models. Energy spread over charging time and energy spread over plugged-in time give different answers wherever cars sit after they finish charging. That’s why the hotel range is widest. For a fast-charging session, where charging and plugged-in time nearly coincide, the two models barely differ.
So the venue mix behind a “public charging” class decides how much of its energy lands in your window. That’s roughly a two-to-one swing between workplace-heavy and corridor-heavy portfolios.
Weekday is not weekend, and one venue runs overnight
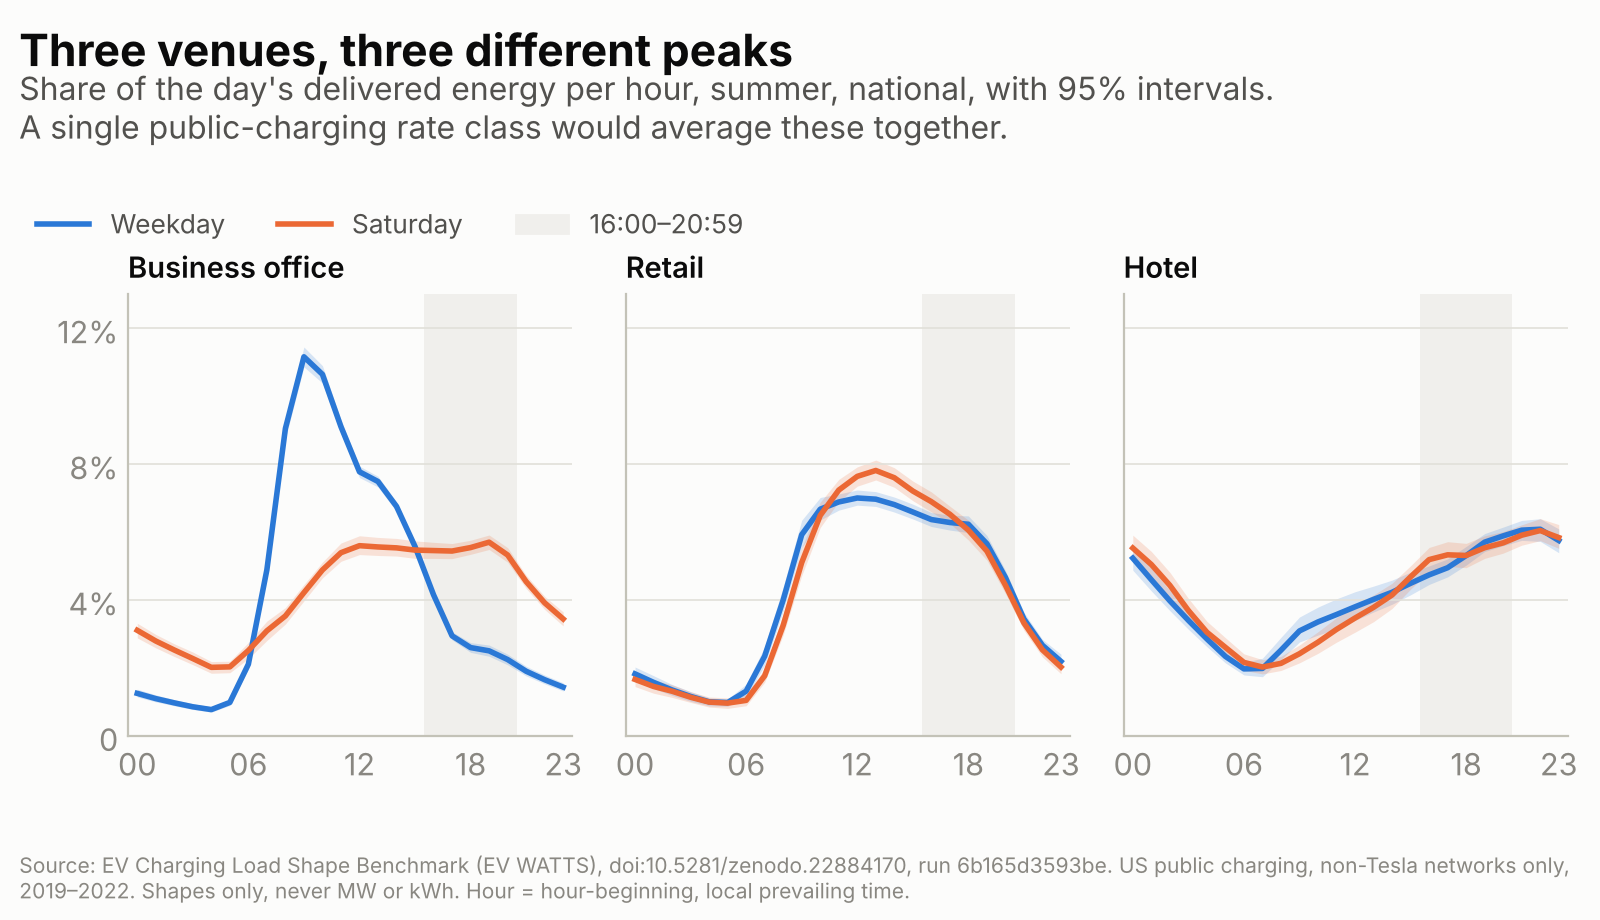
Office charging is the clearest case. On a weekday, 14.5–15.5% of its energy falls in the 4–9 pm window. On a Saturday it’s 25.3–27.5%, because the morning commuter spike disappears and the day flattens out. Retail barely changes between the two. Hotel charging climbs all evening and peaks around 22:00 on both days.
What this can and cannot do in a rate proceeding
It can give a measured, citable reference for how a public-charging class’s energy is spread across hours you have already defined. It can also test whether an assumed or simulated class shape is consistent with measurement, hour by hour, with stated uncertainty.
It cannot tell you where to put the window. TOU period boundaries come from hourly marginal cost, not from the shape of the end use being priced. Using a load shape to justify a period boundary gets the reasoning backwards, and an expert witness will say so.
It cannot measure price response. The source has no tariff or price field, so nothing here says how drivers would react to a different rate.
It cannot price demand charges. Demand charges are set on the 15-minute peak. Hourly average shares can’t represent that peak.
It is not a 90/10 load-research sample. That standard governs the estimation of a class’s coincident-peak mean for cost allocation, in absolute kW, under an approved sampling plan. This is distributional shape, scale-free, with bootstrap intervals, and it should be described that way in any filing.
It is shapes, never totals. EV WATTS has no sampling frame, so you supply the magnitude. Geography stops at the Census division in the published cuts. Fast charging appears only as highway corridor, because in this dataset venue determines charger level.
Get it
The package is at doi.org/10.5281/zenodo.22884170. The 4–9 pm share is a sum you can compute yourself from energy_share (and energy_share_alt for the second allocation model) over hour_beginning_lpt 16 to 20. Note the clock: hour-beginning, local prevailing time. That differs from the hour-ending, local-standard convention most rate filings use, so align it to your own window definition first.
If you work on EV rates and your class load-shape assumptions disagree with these shapes, I’d value hearing where.
An independent work by James Sanders. It is not produced, reviewed or endorsed by the U.S. Department of Energy, NREL, Energetics or any EV WATTS project partner. Provided as is; see the package licence.

