
Every figure here is a share of charging energy, measured at non-Tesla public chargers. Nothing here is a megawatt or kWh estimate.
Xcel Energy asked Colorado regulators to approve about $4.9 billion of distribution capital for 2025 to 2029. When the Public Utilities Commission ruled on that plan in December 2025, it also gave the company a modelling instruction. Public Level 2 and DC fast charging were to be evaluated separately, and public-charging assumptions refined from real usage data.
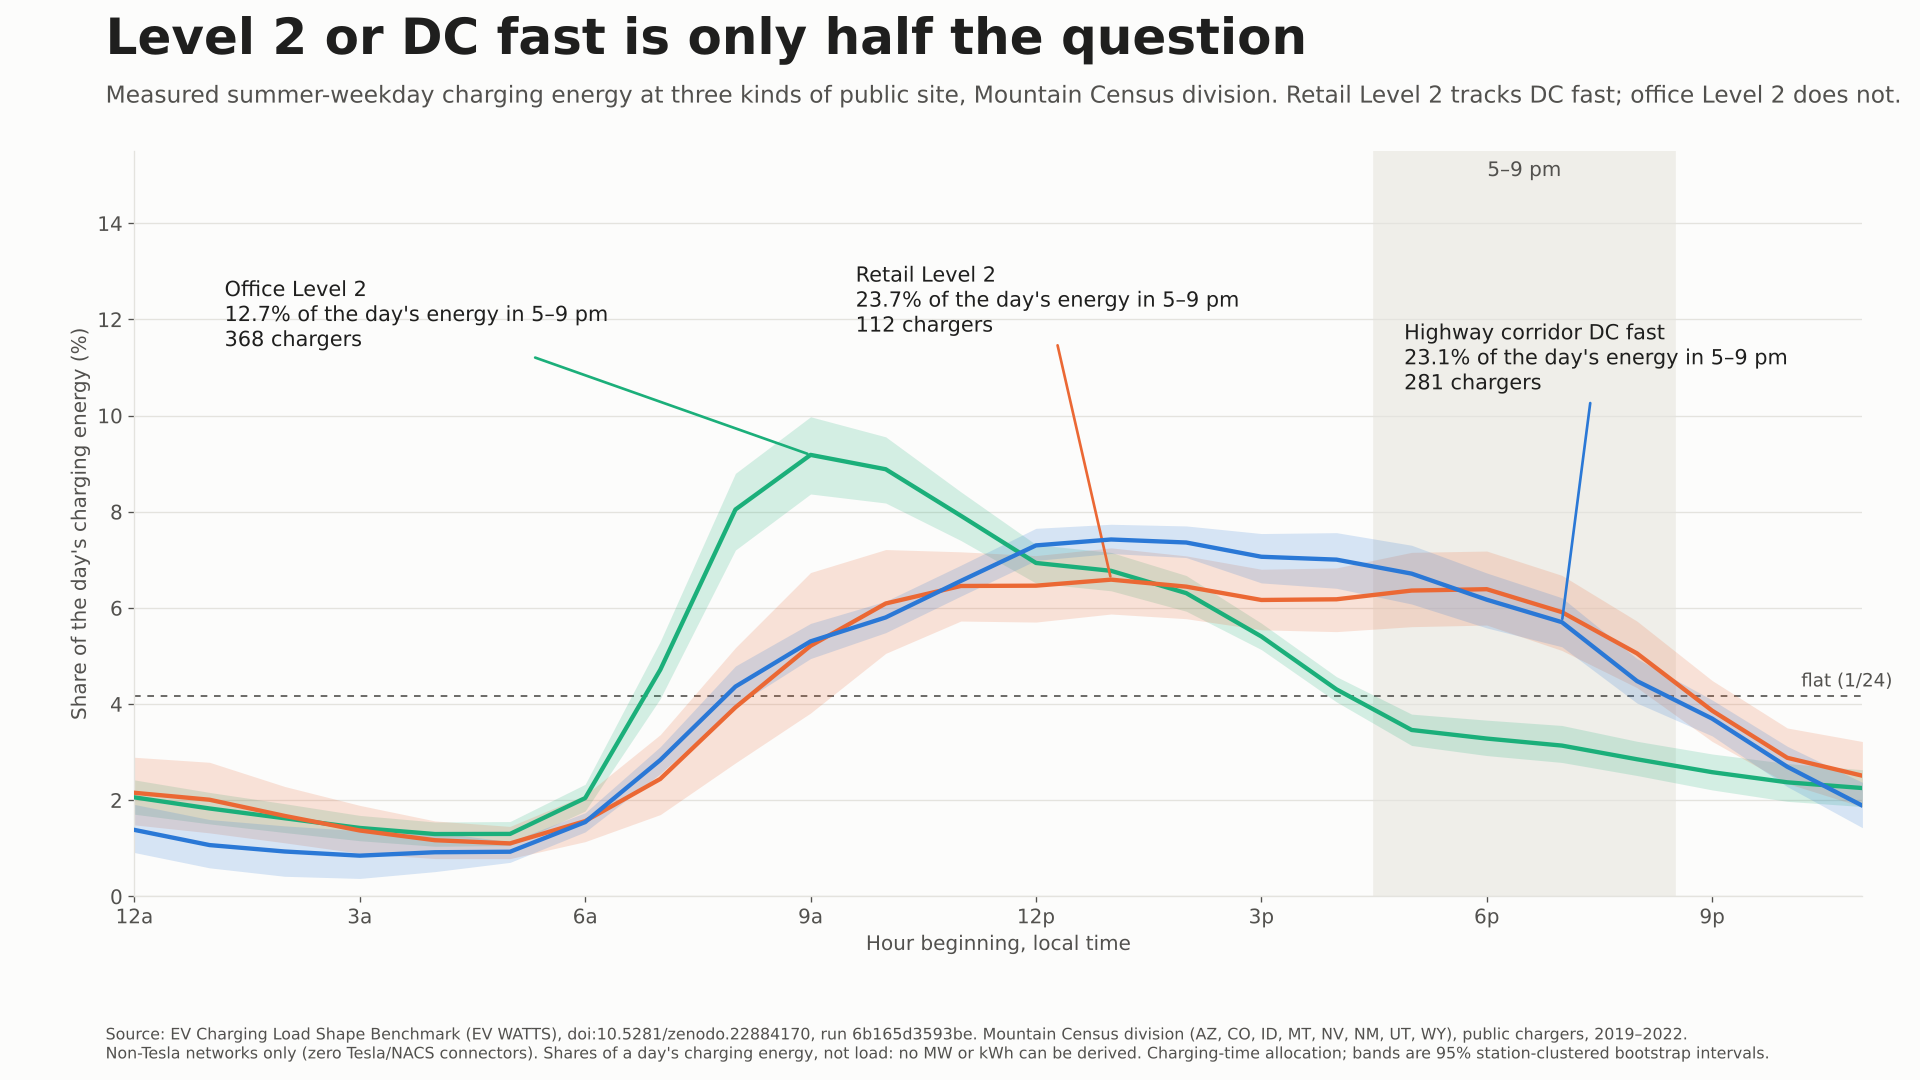
The Commission was right to separate the two. Measured public charging in the Mountain West also shows a second split that matters as much: within Level 2, the type of site changes when the energy is drawn. In the Mountain Census division, office chargers put 12.7% of a summer weekday’s energy into 5–9 pm. Retail Level 2 puts in 23.7% and highway DC fast chargers 23.1%. A flat profile would put in 16.7%.
This piece sets out what the decision asked for, what four years of metered sessions show about those patterns, and what this evidence cannot tell a Colorado planner.
What the Commission asked for
In Decision No. C25-0903 (Proceeding 24A-0547E, issued December 15, 2025), the Commission directed Xcel to carry adjustments from its resource-planning case into LoadSEER, the model it uses to project distribution load. Paragraph 87 (p. 40) lists them. Three concern EV charging:
- “Assume 50 percent managed charging for BEV, 90 percent for PHEVs by end of decade”
- “Evaluate Level 2 and DCFC charging uniquely as proposed by WRA and apply specific patterns if appropriate”
- “Refine public charging peak load and geospatial assumptions based on actual installation trends, AMI usage data and other relevant inputs”
Paragraph 88 looks ahead to the next plan. For it, the company “should produce a thorough evaluation of usage patterns including load shapes and magnitudes” from its smart-meter (AMI) data.
The direction is clear: charging shapes should come from metered behaviour, and public Level 2 and fast charging should not share one curve. The rest of this piece asks what metered public charging in the region already shows.
What measured public charging shows
In this data, “public Level 2” is at least three shapes, and DC fast is one more. The figures are the share of a day’s charging energy drawn in each hour at chargers in the Mountain Census division. The division covers Arizona, Colorado, Idaho, Montana, Nevada, New Mexico, Utah and Wyoming.
Workplace-type Level 2 peaks in the morning. On summer weekdays, energy at office, medical or educational campus and municipal chargers peaks in the hour beginning 9 am. Office chargers draw 9.2% of the day’s energy in that one hour (95% interval 8.4–10.0%, 368 chargers). Only 12.7% falls in 5–9 pm, below a flat profile’s 16.7%.
Retail Level 2 looks like DC fast, not like office Level 2. Retail and highway-corridor DC fast chargers both peak in the hour beginning 1 pm on summer weekdays. Each puts about 23% of its energy into 5–9 pm: 23.7% at retail (112 chargers), 23.1% at corridor DC fast (281 chargers).
Hotels and leisure destinations peak in the evening. Weekday energy at hotel chargers peaks in the hour beginning 9 pm, and at leisure destinations at 6 pm.
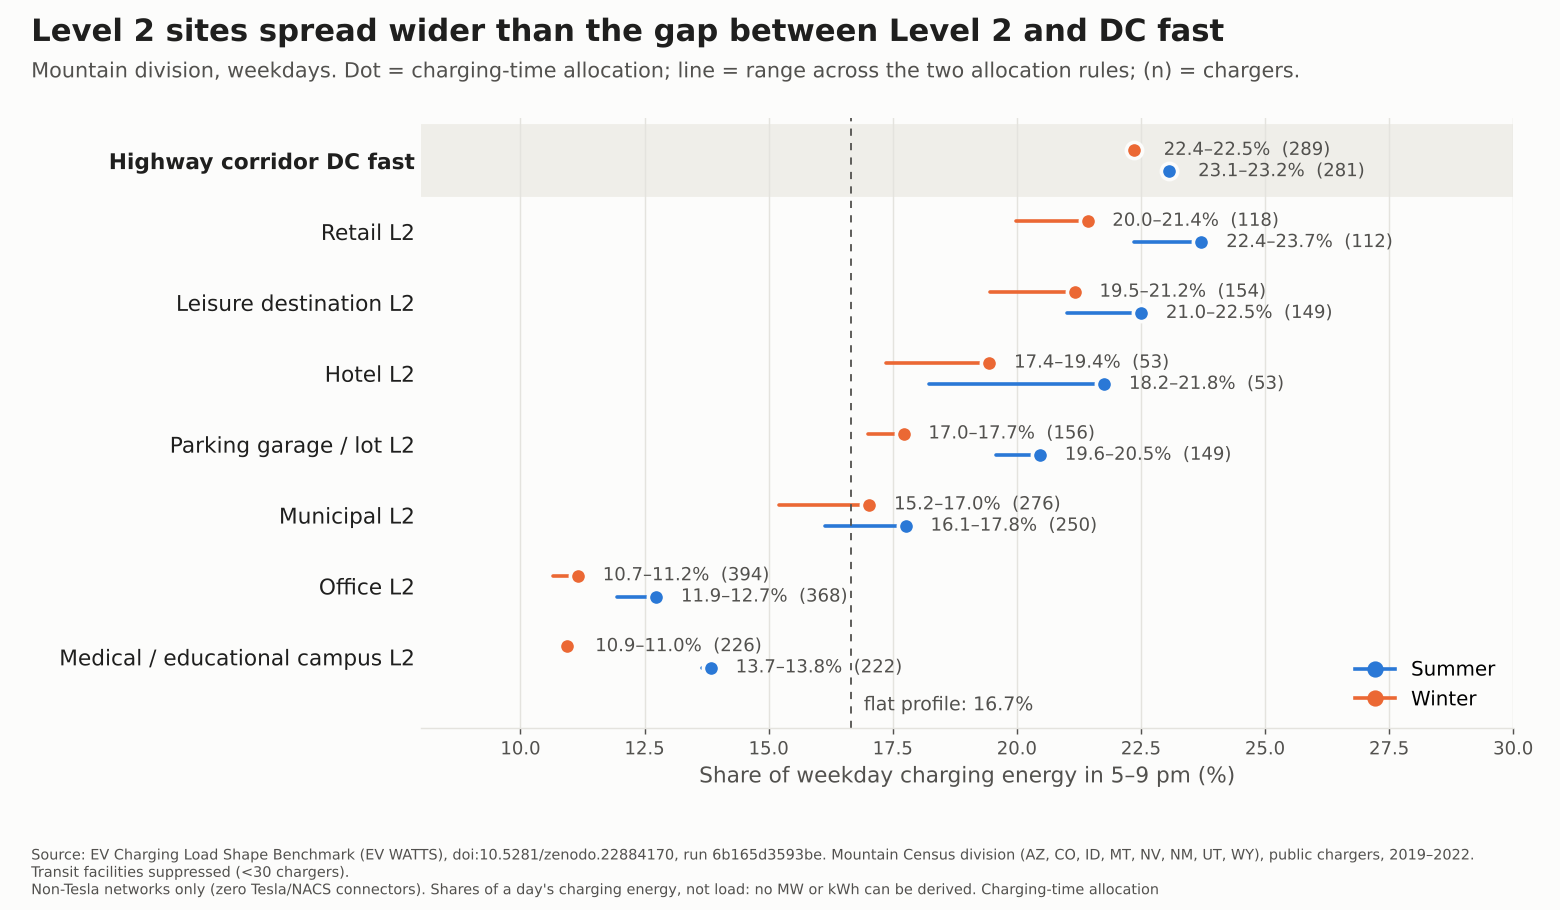
The spread within Level 2 is larger than the gap between Level 2 and fast charging. On summer weekdays the 5–9 pm share ranges from 12.7% to 23.7% across the eight Level 2 site types, an 11-point spread. Corridor DC fast sits at 23.1%, inside that range. Winter weekdays look much the same: Level 2 runs from 10.9% (campus) to 21.4% (retail), and corridor DC fast sits just above at 22.4%.
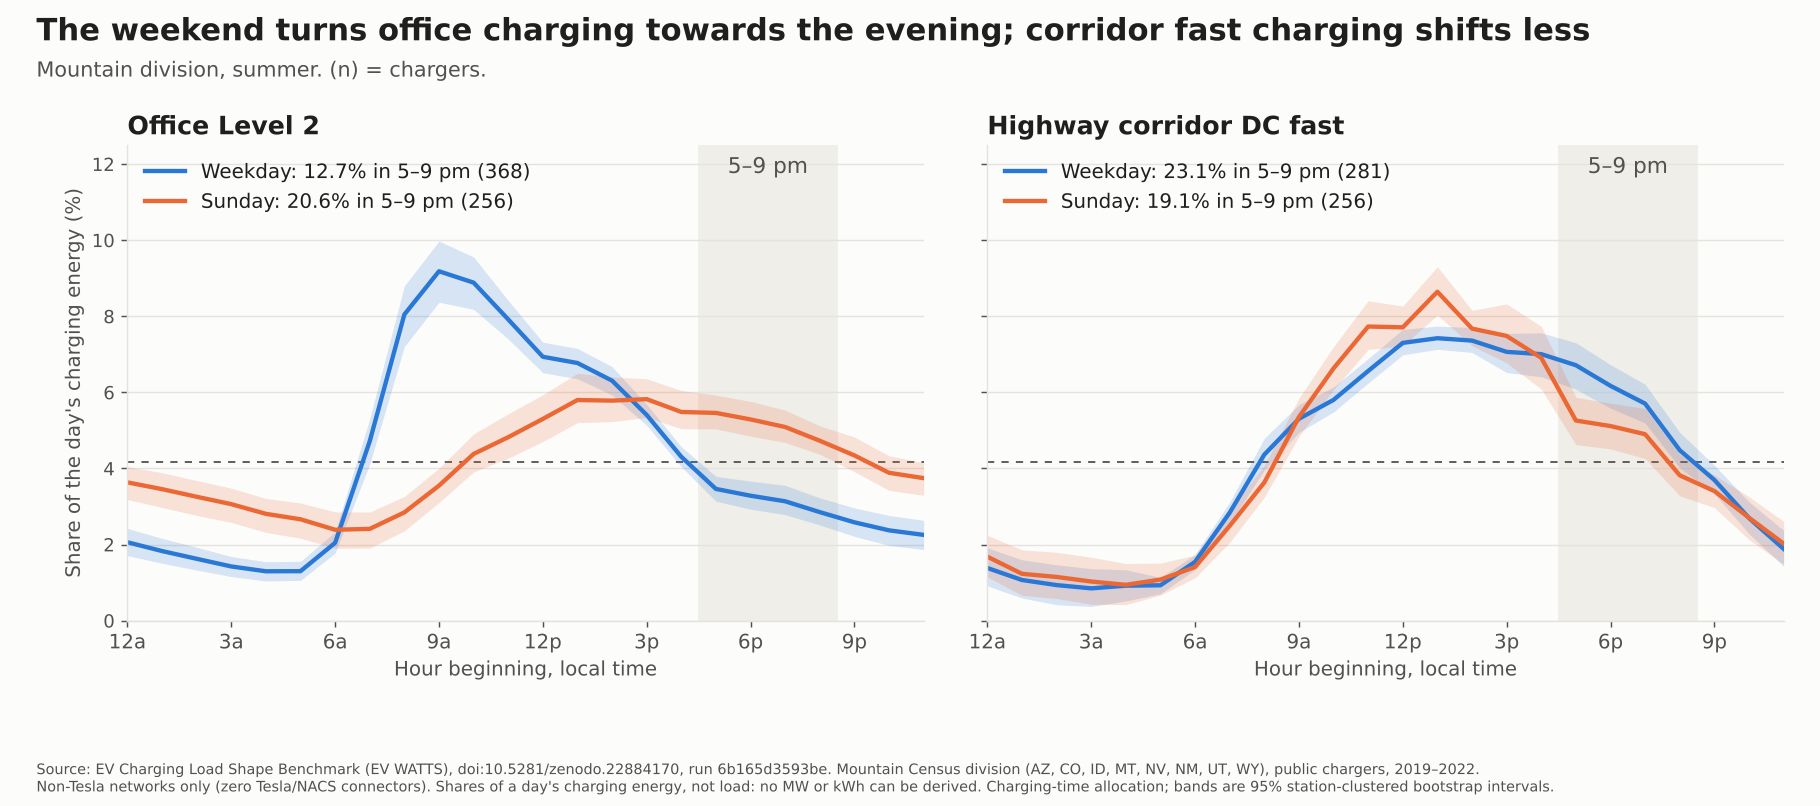
Day type moves workplace sites the most. On summer Sundays the office share of 5–9 pm rises to 20.6%. Corridor DC fast falls to 19.1%. A single weekday curve per charger type misses that reversal.
On these numbers, splitting Level 2 from DC fast is necessary but not sufficient. A Level 2 curve weighted towards offices and one weighted towards retail differ by almost a factor of two in the evening window. Which one a planner gets depends on the mix of sites, not on the charger type.
What this can and cannot tell a Colorado planner
The evidence answers one part of the Commission’s question: what public Level 2 and DC fast charging patterns look like when measured. Most of the rest is out of its reach.
It can give:
- the hourly shape of public charging by site type, season and day type, with sampling intervals
- the share of energy in any window, such as Xcel’s residential on-peak of 5–9 pm on non-holiday weekdays, approved in February 2025 to start no earlier than October 2025
- peak-hour share and load factor for each site type: ratios that carry over to any fleet size
It cannot give:
- Colorado on its own. The data has no state field. The finest public geography is the eight-state Mountain division.
- Peak load in kW or MW. The sample has no sampling frame, so no total can be scaled from it. “Public charging peak load” in the directive is a magnitude; this evidence offers its shape only.
- Location. Nothing places a charger on a feeder or substation, so the “geospatial” half of the directive is out of reach.
- Home charging, or the 10 kW household value. Both are about homes; this data is public chargers only.
- Tesla or very fast charging. The network has no Tesla connectors. Its fast chargers date from 2019–2022, before today’s 150 kW-and-up corridor sites.
- Managed charging response. Sessions are as they happened, mostly before any managed-charging programme.
Xcel’s own smart-meter data, which the Commission asked for, can answer what this cannot. A public benchmark is best used as a cross-check on that work.
Data, method and disclosures
- Source. EV Charging Load Shape Benchmark (EV WATTS), doi:10.5281/zenodo.22884170, run 6b165d3593be. Built from the public-domain EV WATTS dataset: 13,937,235 charging sessions, 2019–2022.
- Non-Tesla only. The dataset contains no Tesla or NACS connectors. Every figure describes non-Tesla public networks.
- Shares, not load. Each figure is a share of a day’s charging energy. EV WATTS is a convenience sample of partner networks with no expansion weights, so no MW or kWh total follows from it.
- Geography. Mountain Census division, the finest level published for DC fast charging. Site type is the host’s label. Corridor sites are all DC fast; the other site types are all Level 2. Charger counts are chargers (EVSE), not sites.
- Hours. Hour beginning, local wall-clock time. Arizona does not observe daylight saving time, and Phoenix-area chargers are stamped inconsistently; they are 23 of 11,482 public-venue chargers nationally.
- Allocation. Each session’s energy is spread over its charging time (headline figures) or over its whole connected time (the alternative). Figures show both where they differ.
- Intervals. 95% station-clustered bootstrap, 1,000 replicates. Cells with fewer than 30 chargers are suppressed; Mountain transit facilities are suppressed for that reason.
- Independence. The author has no commercial relationship with Xcel Energy or any party to Proceeding 24A-0547E.

