
Most fault-prediction, churn-prediction, and risk-prediction work defaults to binary classification: will this thing happen in the next N days, yes or no. That framing throws away information. An asset that hasn’t failed yet, a student who hasn’t dropped out yet, a patient who hasn’t had a recurrence yet — none of those are missing data points. They’re censored observations, and each one bounds the outcome even without an event attached to it. I’ve built this reframe myself for one of these problems. It turns out the same shape already exists, as documented published work, in two other domains I care about but haven’t built a survival model in myself. A conversation with a former colleague is what made the pattern visible to me in the first place.
Thanks to Aaron Epel (Senior Data Scientist at Stem at the time of this conversation; now at NextEra Energy, Inc.), my guest on the AI Coffee Chats podcast and a former colleague from our time together at IHS Energy, for making the connection to medical survival analysis explicit in our conversation — a connection I’d been building toward without naming it directly. That conversation is the reason this piece exists.
The full episode is available here.
The Problem With Binary Framing
Asset failure prediction on the electricity grid has historically been approached as classification: given a device’s operating history, predict whether it will fail within some fixed window. Aaron described this as the default framing when he started in the field, and it has an obvious appeal — it maps cleanly onto standard classifiers and standard evaluation metrics.
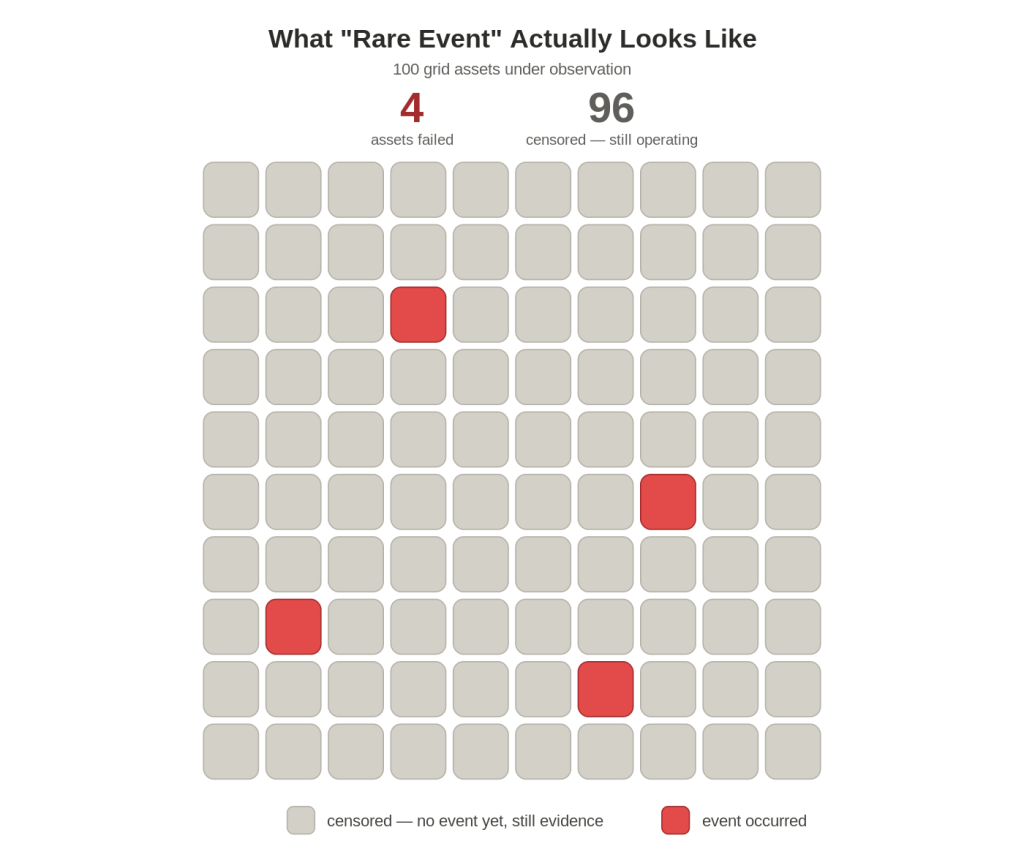
It also has a cost. Grid faults are rare events by design; a well-run distribution network is one where failures are infrequent. That’s good for customers and bad for training data, because it leaves you with heavily imbalanced classes and very few positive examples to learn from1. The standard toolkit for correcting class imbalance — resampling, synthetic augmentation, class weighting — was largely developed for domains like image classification, where you can rotate, crop, or otherwise transform an example without changing its label. That doesn’t transfer cleanly to asset telemetry.
The Reframe: Time-to-Failure Instead of Will-It-Fail
The reframe Aaron pointed me to traces back to a master’s thesis by Egil Martinsson, written in the context of e-commerce customer churn prediction, that recasts the yes/no failure question as a time-to-event question: not will this fail, but how long until it fails2. The practical version of this, WTTE-RNN (Weibull Time-To-Event Recurrent Neural Network), trains a recurrent network to output the parameters of a time-to-event distribution at each timestep rather than a class probability.
The distinction matters most for what it does with the negative examples — which, in a rare-event setting, is most of your dataset.
Why Censored Data Is Evidence, Not Missing Data
This is the core idea, and Aaron stated it more precisely than I could have:
“You may not have that many examples of cases where your asset has failed in the past, but every day that your asset has not failed yet in your training data set tells you some evidence — it tells you: under these conditions I have such and such amount of time before my asset will fail. But if your asset hasn’t failed yet by the time you stopped collecting your data, that also gives you evidence that says: I don’t know when it’s going to fail in the future, but I know it at least isn’t until today. And that’s also evidence that you don’t want to throw out.”3
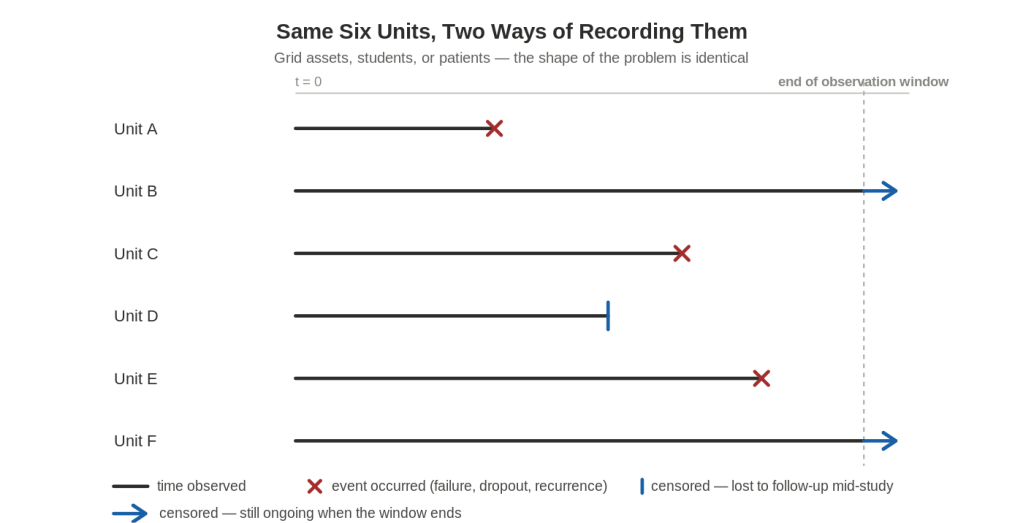
A binary classifier treats every non-failure identically: label zero. A time-to-event model treats a non-failure as a right-censored observation — the true failure time is unknown, but it’s bounded below by however long the asset has already survived. That’s strictly more information than a zero label, and it’s information a rare-event dataset can’t afford to discard.
Aaron traced the lineage of this idea directly to public health:
“That sort of gets back a little bit to the medical field, right, where a lot of the algorithms for this survival analysis originally did come from survival analysis of cohorts taking part in clinical trials.”4
That’s not a loose analogy. It’s the same statistical machinery — hazard functions, censoring, concordance — applied to a different failure mode.
Three Domains, One Reframe
The same reframe shows up in three separate projects — one of them mine, two of them published research in domains where I haven’t personally built a survival model. The underlying question is identical in each case: given a unit that hasn’t yet experienced an event, what does its survival so far tell you about when the event is likely to occur?
| Domain | Project | Method | Result |
|---|---|---|---|
| Grid / energy | High-voltage instrument transformer maintenance planning, Dutch transmission system (Khuntia et al., 2022) | Kaplan-Meier survival curves + Weibull distribution fitting on real failure/inspection data (1989–2021) across three voltage levels | Produced voltage-level- and age-specific remaining-life estimates, used to simulate maintenance/replacement scenarios for CAPEX, inspection hours, and downtime risk5 |
| EdTech | Early dropout prediction, Wayne State University (Ameri et al., 2016) | Cox proportional hazards regression + time-dependent Cox (TD-Cox), incorporating demographic, financial, high-school, and semester-wise credit covariates | Predicted both whether and which semester a student would drop out, enabling proactively prioritized intervention with limited academic resources6 |
| Healthcare | Breast cancer survival prediction, TCGA BRCA cohort (1,236 patients) | Cox Proportional Hazards vs. Gradient Boosting Survival Analysis vs. “vanilla” classifiers | Cox PH C-Index of 0.734 at the 3-year horizon, the best of four candidate models7 |
The breast cancer project is mine, and it uses Cox PH directly, evaluated with concordance rather than accuracy. The grid and EdTech rows aren’t my own work — they’re published examples of researchers applying the same censored-data reframe in domains I care about. That’s worth being honest about: this isn’t a novel idea I’m claiming credit for in every domain. It’s an established technique in grid asset management and EdTech dropout research specifically, even though — in my own experience building production systems adjacent to both fields — classification is still what most teams reach for first.
That’s also worth addressing directly: if WTTE-RNN exists, why do all three production examples here — Khuntia et al., Ameri et al., and my own breast cancer model — use Cox PH or Kaplan-Meier instead of a neural time-to-event formulation? In practice, the choice comes down to what the deployment actually needs. Cox PH gives you a hazard ratio per covariate, which is directly interpretable by a maintenance engineer or an academic advisor without a machine learning background — that matters when the model’s output has to justify a decision to a non-technical stakeholder. WTTE-RNN and similar neural formulations trade that interpretability for the ability to model non-linear, sequential feature interactions and to update predictions as new time-series data streams in. If your covariates are largely static per unit and your audience needs to trust individual hazard estimates, Cox PH wins. If you’re already running a deep learning pipeline on high-frequency sequential data and interpretability is secondary to real-time updating, WTTE-RNN is the better fit. None of the three domain examples here needed the second thing badly enough to give up the first.
Where the Analogy Breaks Down
The three domains don’t share a censoring mechanism, and that’s worth being explicit about rather than glossing over. In the breast cancer cohort, censoring happens because a patient exits the study for reasons unrelated to the outcome being measured — they move away, the study ends, they’re lost to follow-up. In student persistence modeling, a “censored” student is one who is still enrolled at the time of scoring, which is closer to true right-censoring. In grid asset monitoring, an asset that hasn’t failed by the end of the observation window is censored in the same formal sense, but the underlying hazard is driven by physical wear rather than behavioral or biological processes, which affects which hazard function assumptions are reasonable to make.
Treating all three as interchangeable would be a mistake. The reframe transfers; the specific model choice and hazard assumptions don’t.
Future Work
- Test whether a WTTE-RNN-style formulation outperforms Cox PH on the breast cancer cohort, where the current best model is a proportional-hazards model rather than a neural time-to-event model
- Apply a Cox PH or TD-Cox framework directly to Excelsior’s own persistence data, following Ameri et al.’s approach, rather than relying on published results from a different institution — Excelsior’s current pipeline is a classifier, not a survival model
- Test whether a semi-Markov or multi-state model fits recurrent, non-terminal grid faults better than a single-event survival model — a transient fault that doesn’t end an asset’s service life isn’t well captured by a framework built around one terminal event, and that’s worth testing directly rather than assuming the single-event framing generalizes
- Look for a fourth domain outside grid, EdTech, and healthcare where the same censored-data problem is being solved as classification by default
Conclusions
The specific finding here is narrow: three prediction problems across three domains — grid asset behavior, student persistence, and cancer survival — are the same underlying statistical problem, and treating non-events as censored observations rather than negative labels uses information that binary classification discards. I’ve only built this reframe myself in one of the three; the other two are drawn from published research, which is itself worth noting honestly — the technique exists and is documented, but in my own experience building production systems in and around grid and EdTech work, classification is still the default most teams reach for first. Reframing to time-to-event requires deliberately choosing a different toolkit, even where the published playbook for doing so already exists.
I’m curious whether others working in asset reliability, EdTech, or clinical risk modeling have run into the same default-framing trap, and what it took to notice it.
References
- Aaron Epel, “Machine Learning and the Electric Grid,” AI Coffee Chats, September 3, 2024. https://www.youtube.com/watch?v=8Hvp4lYzfIY
- Egil Martinsson, “WTTE-RNN: Weibull Time To Event Recurrent Neural Network,” Master’s Thesis, Chalmers University of Technology / University of Gothenburg, 2017. https://publications.lib.chalmers.se/records/fulltext/253611/253611.pdf — note: Aaron cites this as “2015” in the podcast audio (timestamp 18:50); the thesis itself is dated 2017. Verified directly against the PDF before using this citation.
- Aaron Epel, AI Coffee Chats, timestamp 20:48–21:35.
- Aaron Epel, AI Coffee Chats, timestamp 22:17–22:33.
- Swasti R. Khuntia, Fatma Zghal, Ranjan Bhuyan, Erik Schenkel, Paul Duvivier, Olivier Blancke, and Witold Krasny, “Use of survival analysis and simulation to improve maintenance planning of high voltage instrument transformers in the Dutch transmission system,” 16th WCEAM Proceedings, 2022. https://arxiv.org/abs/2301.01239
- Sattar Ameri, Mahtab J. Fard, Ratna B. Chinnam, and Chandan K. Reddy, “Survival Analysis based Framework for Early Prediction of Student Dropouts,” Proceedings of the 25th ACM International Conference on Information and Knowledge Management (CIKM ’16), 2016, pp. 903–912. https://doi.org/10.1145/2983323.2983351
- James Sanders, “Breast Cancer Survival Prediction: Algorithms and Survival Factors,” jamesaksanders.com, January 5, 2024.

