I Tried to Verify That on a Public Dataset.
James Sanders • Data Scientist & ML Engineer • jamesaksanders.com
The pitch for battery digital twins right now is consistent across the industry: combine physics models with AI and real telemetry, and you get predictions that are both mathematically valid and physically possible. That’s a near-direct quote from a March 2026 Exponent piece on EV battery digital twins, by Dustin Burns et al. It’s not just a consulting framing, either — Fluence’s own Life Model, running across their BESS fleet today, is described the same way: a “cell-level degradation engine calibrated with lab and fleet data” that predicts capacity fade and informs project sizing.
I wanted to test that premise directly on a public dataset rather than take it on faith. If you work in grid-scale battery storage, you already know that state-of-health (SOH) modeling lives or dies on one assumption underneath that pitch: that your “hard cases” — the cells actually experiencing the operating stress you’re trying to predict — are correctly identified in the first place. I recently learned, the hard way, how easy it is to get that assumption wrong without ever noticing.
The specific hypothesis: that adding a physics-based temperature term (an Arrhenius-style acceleration factor, the same mechanism used in several recent published SOH frameworks) would help a neural network handle battery cells that experience real temperature swings — the “drift” cells — better than a plain LSTM could on its own. This is a reasonable, well-precedented thing to expect, and it’s the same logic behind the lab-plus-field calibration pitch above. It’s also, in my case, not what happened, and the reason why is more interesting than the result itself.
The manifest was wrong before the benchmark even started.
My initial data pull flagged 16 cells in the NASA PCoE battery dataset as “drift” cells — cells whose operating temperature changed partway through their test life. When I went back to verify that manifest against the raw files before publishing anything, the number dropped to 7.
The bug was mechanical and, once found, completely unambiguous: the labeling logic checked for more than one distinct ambient_temperature value anywhere in a cell’s full cycle record — charge, discharge, and impedance spectroscopy cycles alike. NASA’s testbed logs its periodic EIS impedance spot-checks at a fixed 24°C reference reading, regardless of what temperature the aging chamber is actually holding for the charge/discharge cycles around them. So a cell held at a genuine, constant 4°C for every single discharge cycle of its life — the only cycles that actually define its SOH trajectory — would still show {4°C, 24°C} in its raw metadata, purely because of an instrumentation artifact from an unrelated measurement type. Filter to discharge cycles only, and 13 of those 16 “drift” cells instantly collapse to a single, unchanging temperature.
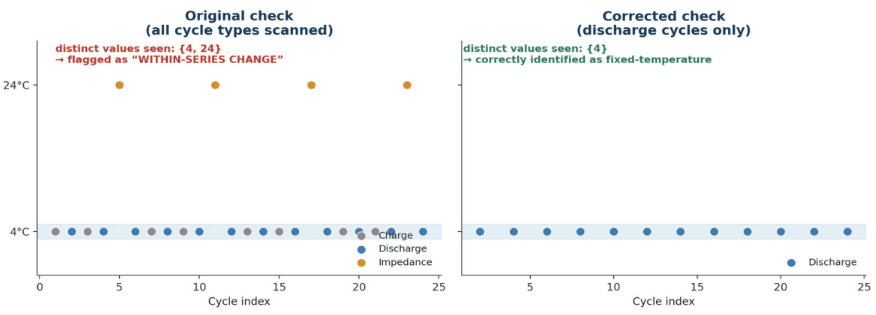
Why a constant-4°C cell got flagged as “drift” — illustrative schematic based on the confirmed labeling logic
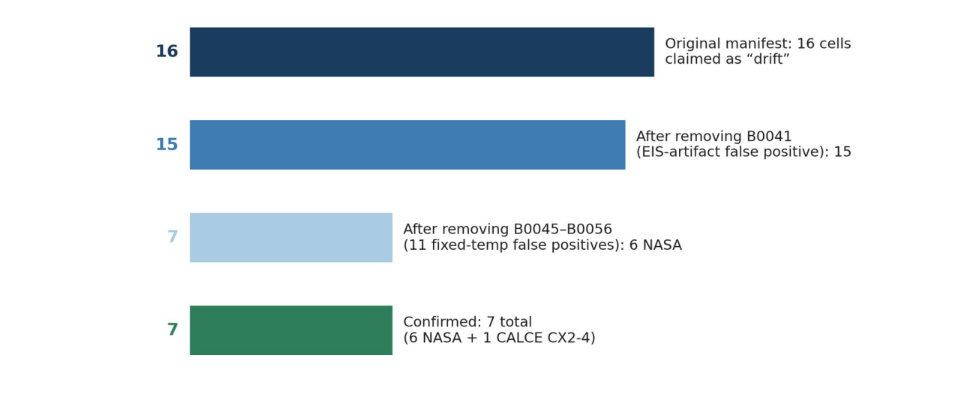
Re-verifying the raw NASA PCoE files cut the confirmed drift-cell count from 16 to 7
If you’re building any kind of automated condition-flagging or anomaly-labeling pipeline on multi-modal telemetr — and if you work in AMI, DER, or grid-storage analytics, you almost certainly are — this is worth sitting with. The failure mode here wasn’t a bad model. It was a labeling script that technically read the right field, from the right dataset, and still produced a systematically wrong answer, because it didn’t account for which kind of measurement event it was reading that field from.
The benchmark itself needed a second correction, too.
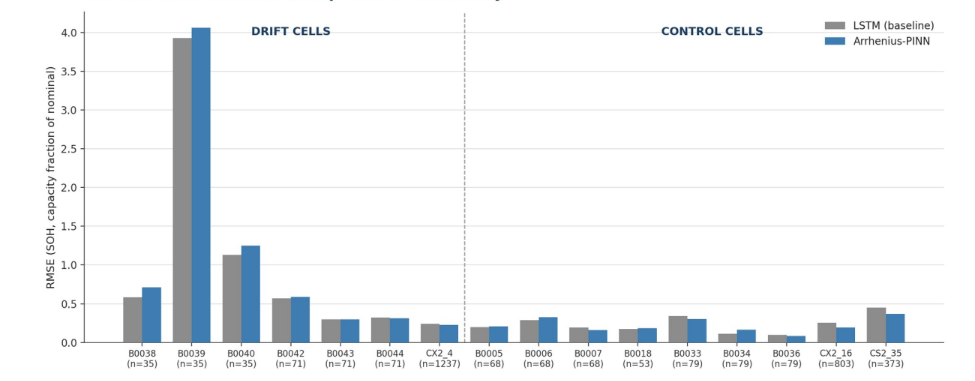
Once I had the corrected 7-cell drift set, the headline result looked clean: the physics-augmented model was 3.3% worse (RMSE) than the plain LSTM on genuine drift cells, and 16.9% better on fixed-temperature control cells — exactly the inverse of what the physics term was supposed to buy you. That’s a publishable, interesting negative result on its own.
But a pooled RMSE delta across 7–9 cells is a thinner foundation than it looks. When I broke it down per cell, only 4 of 7 drift cells individually agreed with the aggregate direction. I also ran a paired significance test at the cycle level, which is a common approach in this literature — but cycles within the same cell aren’t independent observations, since they share that cell’s degradation trajectory. Treating them as independent inflates the effective sample size and can manufacture an artificially confident result. Sure enough, the control group’s cycle-level test came back extremely significant (p < 0.00001) — exactly the kind of number that pattern is known to produce. The test that actually respects the data’s structure is a bootstrap resampled at the cell level, since the cell, not the cycle, is the real independent unit. That test told a very different story: both groups’ 95% confidence intervals straddled zero. Neither the drift-side regression nor the control-side improvement is distinguishable from sampling noise, once the check is run at the correct level.
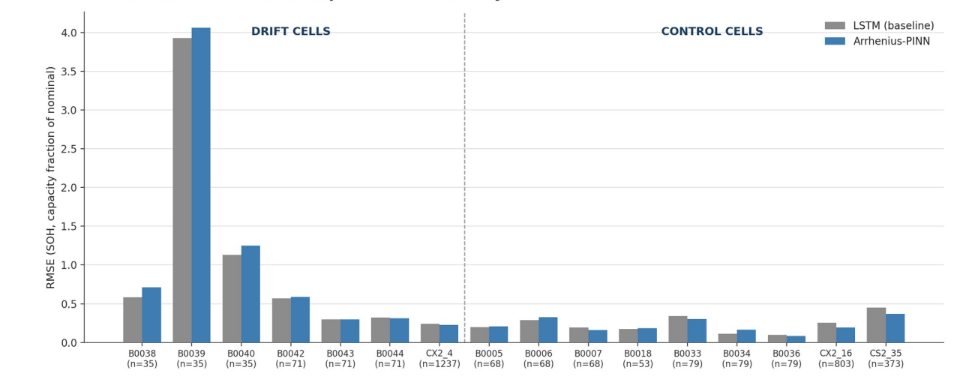
Per-cell RMSE: neither the drift group nor the control group tells a clean, unanimous story
Why this matters beyond one physics term.
Most published SOH benchmarks on this dataset — and I’d guess a fair number of internal grid-storage model evaluations — compare pooled error metrics across a small number of cells (often just 3–4) without checking whether that pooled number would survive being resampled, or whether it’s being carried by one or two atypical units. Seven to nine cells is already more than the field’s typical practice, and it still wasn’t enough for either half of my original comparison to hold up cleanly.
If your team is evaluating SOH, load-forecasting, or anomaly-detection models against a small number of “representative” assets — a handful of feeders, a handful of battery packs, a handful of substations — the same question applies: would your headline number survive a cell-level bootstrap, or is it one atypical asset doing most of the work?
I’m curious whether others in grid-storage analytics have run into a similar gap between a pooled benchmark number and what actually holds up under a per-unit breakdown — happy to compare notes.
References
Burns, D. & Mendias, M. “Turn EV Battery Data Into Reliable Digital Twins.” Exponent, March 31, 2026.
Winter, TJ & Shi, G. “Beyond 20 Years: Maximizing Battery Storage Lifespan and Value.” Fluence Energy Blog.
NASA Prognostics Center of Excellence (PCoE). Li-Ion Battery Aging Dataset. NASA Ames Research Center.
CALCE Battery Research Group, University of Maryland. Battery aging and cycling datasets (CX2, CS2 cell series).
LSTM–PINN framework for physically consistent battery state-of-health prediction. Scientific Reports, 2026.
Physics-Informed Neural Networks for Battery Degradation Prediction Under Random Walk Operations. Quality and Reliability Engineering International (Wiley), 2026.

